One of the great things about working in a startup, is the fact that you’re building something from scratch, and the whole business is (usually) very transparent. But once the growth starts kicking in, and you get busy working, whether it’s developing like me, generating ideas, making sure the ads are running etc., it’s very easy to loose track of how the business is actually performing.
That’s why you use KPIs (Key Performance Indicators), to get a ‘here and now’ feel of how you’re performing; possibly both on macro- and microlevels.
At DuGlemmerDetAldrig, we’ve been running GeckoBoard for a long time, but it wasn’t until November ’15 we actually sat down, and started looking at what KPIs we could display, for the whole team to get a feeling of our direction.
The importance of KPIs
Before we set up our new dashboards, the KPIs we had were picked out pretty randomly. They gave quick glance of how the business were performing, but only on the surface. The idea of KPIs are, that you should be able to monitor your business on both the micro- and macro scale. You need to identify metrics, that you can actually influence and improve on a daily basis, but also be able to get a bigger picture of how you’re doing.
We sat down and started brainstorming about, what KPIs were important to our business. We ended up with the following:
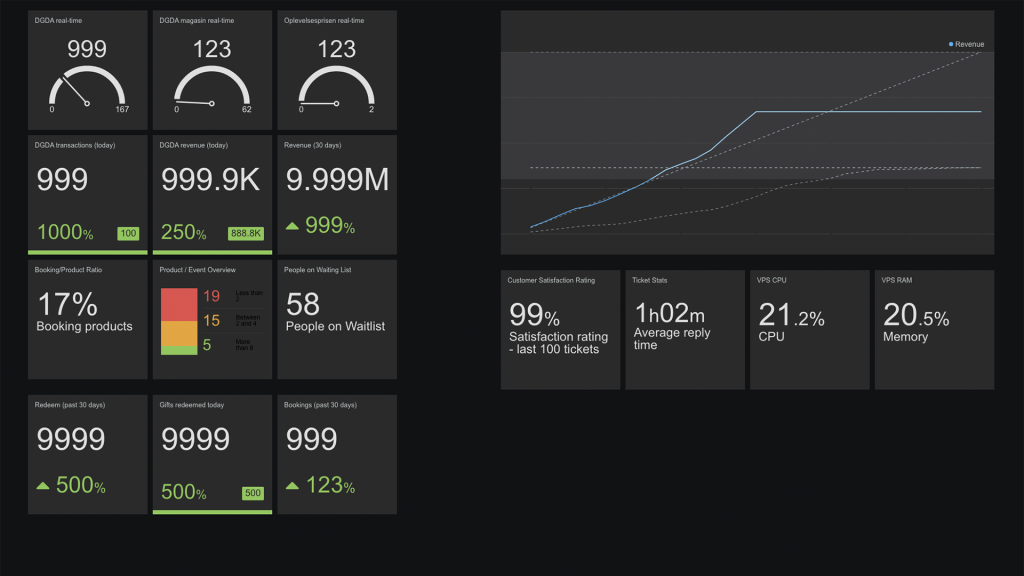
- Current visitors on our platforms
- Transactions today (with a daily goal)
- Revenue today (again, with a daily goal)
- Revenue past 30 days (%-increase compared to last year)
- Booking/Product Ratio (number of products with direct bookings)
- Product/Event Overview (a ‘traffic light’ with intervals showing how many events, our booking-products has)
- People on waiting list (waiting to get bookable dates)
- Redeemed giftcards today (with a daily goal)
- Redeemed last 30 days (%-increase compared to last year)
- Bookings past 30 days (compared to previous period)
- A monthly accumulated revenue-chart with data from part year and current budget goal
- Customer satisfaction (% of last 100 tickets)
- Average customer service respond time
These metrics are the key to our business, and they contain information about both the day-to-day business, and the more ‘long term’ metrics. Other than that, a lot of the metrics, we can influence ourselves by the daily work we do, and not just by throwing more money into Google AdWords and other CPC marketing channels. Also, most important, all of them has a direct influence on how our business is performing, and we can get a quick view of where we need to focus (eg. getting more events, answering our customer service tickets faster etc.)
How do we show our KPIs?
So, this post shouldn’t be about KPIs only, but also how you actually go about getting a dashboard set up.
I have tried a few different dashboard tools; from hosted solutions (like GeckoBoard and Klipfolio) to dashboard templates, that you set up yourself.
My current favorite dashboard tool, is GeckoBoard. I’ve played around with Klipfolio too, but due to a bug in their system, and how they handle SSL certificates, we couldn’t use Klipfolio with our platform(s). We waited a few months for them to fix it, but eventually couldn’t wait any longer, and decided to stick with GeckoBoard. From my experience, Klipfolio seems to be able to handle more advanced dashboards, and being able to display data from a lot of services, including ‘raw data’ from Google Sheets etc., makes it a perfect companion… If it worked properly with our certificates 🙂
GeckoBoard, on the other hand, is a simpler tool, but has a rich API, and is very easy to work with. It also connects to a lot of existing services, and from what I’ve read, it’s possible to utilize a lot of the HighCharts JS library chart features, even though the chart-types aren’t documented in their ‘built in’ API.
I won’t go into detail with any of the ‘self-hosted’ tools here, mainly because the effort it takes to set up and code all the actual widgets yourself, hardly seems like it’s worth the effort, with other such great services out there.
While Klipfolio has a bit of a steeper learning curve, it seems like the more advanced tool, while it’s faster and easier to get started with GeckoBoard. So far I haven’t found anything that GeckoBoard couldn’t handle, but it took some programming to hook it up to our system, and pull data from our APIs. But to set up more specific metrics, you will have to setup some API Endpoints no matter if you’re using GeckoBoard or Klipfolio. So my conclusions is, that you should use the service, that you think looks best, and fits your temper the best 🙂
Our GeckoBoard looks like this:

What do we show them on?
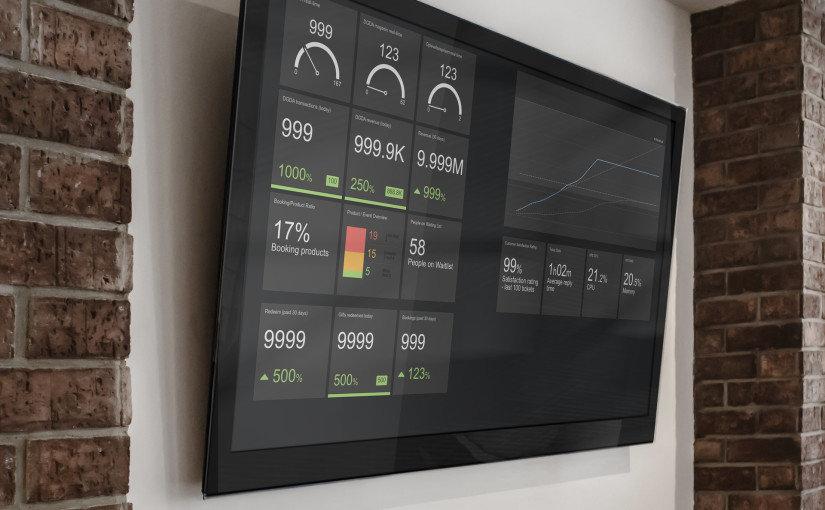
So, now we’ve talked about the importance of having proper KPIs, what tools/services to use, to actually show them. Now we need to discuss actually getting the dashboard up on a monitor. In our office, we have a 48” Samsung TV on a wall, which holds the main dashboard. Other than that, we have a smaller 24” computer monitor for one of our other projects. Depending on the size of your office, a smaller computer monitor might work just fine. Don’t worry about buying a crazy expensive monitor/TV to show your dashboard on. A cheap TV/monitor does the job just fine. My only recommendation would be, that if you buy a TV, make sure it isn’t a plasma TV (not sure they’re even being sold anymore), since being turned on, with a pretty ‘static image’, might cause some ugly burn-ins. Get a LED TV instead, and save your electricity bill too 🙂
Some of the new Smart TVs come with a built-in browser. We tried running our dashboard on the Samsung built-in browser for a while, but after running for a few hours, the dashboard went ‘non-responsive’, and we had to turn off the TV and turn it on again. I’m not sure why, but I think that the browser might either a) block the AJAX-requests loading data or b) cache the AJAX-calls a bit too hard.
Anyway, using the built-in browser wasn’t feasible for us. So far I’ve tried out two different ways:
The Easy Way

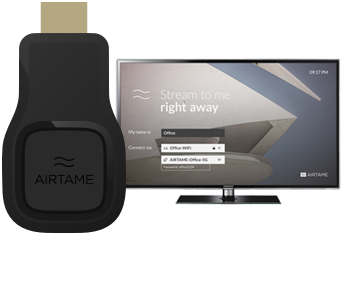
The fastest and easies way to get your dashboard up and running on your monitor, is to get hold of this small HDMI-device, called an AirTame. It’s essentially a mini-computer disguised as a HDMI-dongle. You simply plug it into your TV and a power outlet, and set it up. Once the AirTame is powered up, it guides you on the screen, on how to get started. You simply download a small piece of software from their website, and meanwhile the AirTame sets up a WiFi hotspot that you connect to, once the software is installed. Using the software you configure which WiFi the AirTame should connect to, and once you have done that, showing your dashboard is as simple as copy-pasting the URL to your dashboard into a text-field. Done!
It took me roughly 5 minutes, to have everything set up and my dashboard running. It doesn’t get much easier than that 🙂
The AirTame comes with a few other cool features too. If you’re on the same WiFi as the AirTame, the software you downloaded, lets you stream your monitor directly to the AirTame so you can run presentations, show your favorite meme etc. on the bigger monitor, for others to see too.
But of course, the simplicity comes with a price. The pricetag on an AirTame can be a bit high, if all you want to do, is to show a dashboard. There’s also the (slightly) harder way to get your dashboard up and running. It’s a monetarily cheaper way, but takes some time; so it’s up to you to decide, how much your time is worth 🙂
The slightly harder way
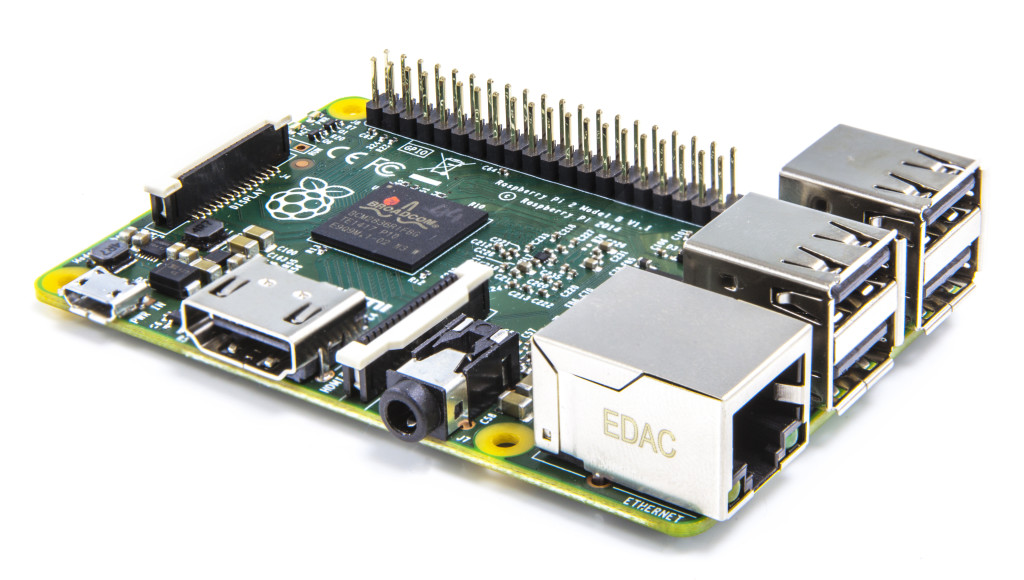
If you’re not afraid of working a bit with a terminal window, you can also use this fancy little computer called a Raspberry Pi, to show your dashboard. A Raspberry Pi can be bought for around $25, and then you’ll need a SD-card and preferrably a case. In total, you’ll be spending about $60–80, and a bit of time.

The Raspberry Pi is a miniature computer, built for educational purposes, and is branded as the ‘$25 computer’. It comes with a guide to install NOOBS, a simple user interface to get started, and install your favorite Linux-distribution. In this guide I’ll tell you how to set up a GeckoBoard, on a Raspberry Pi running Raspbian (A Debian-port for the Raspberry Pi).
Step 1 – Install Raspbian
Follow the guide on https://www.raspberrypi.org/help/noobs-setup/ and install Raspbian.
Step 2 – Configure your Pi
Once the installation is complete, raspi-config will boot. It is a configuration tool, to set the most common settings. Personally I usually enable SSH, to be able to connect and administrate the Pi, without having to plug in a keyboard, once it’s been mounted behind the monitor.
You should also configure the Raspberry Pi to auto-login to X (GUI) upon boot, and without using a login.
Using the configuration tool, you can play around with the different settings. So far I haven’t had any need of overclocking the Pi, but I had to disable overscan to remove the black borders on my monitor.
Step 3 – Login to your Pi
Once you have configured your Raspberry, you need to login and start setting it up to show your dashboard upon boot.
The default username is ‘pi’, and the password is ‘raspberry’. Once you have logged in, we need to get started. Type the following command in your terminal:
sudo nano /etc/lightdm/lightdm.conf
Push Ctrl + W to search, and look for [SeatDefaults]. In that section, add the following line:
xserver-command=X -s 0 dpms
Now press Ctrl + O followed by Enter, to save your changes. Then push Ctrl + X followed by Enter, to exit Nano.
Next up, type the following command, to start installing the required components:
sudo aptitude update;sudo aptitude install chromium-browser chromium-browser-l10n;sudo apt-get install unclutter ttf-mscorefonts-installer
You’ll have to press Y a few times, to accept the installation. Once that’s done, you need to get the Chromium-browser to start upon boot. You do that, by first typing the following:
sudo nano /etc/xdg/lxsession/LXDE-pi/autostart
Once you have opened that file, you should add a # in front of every line already in the file. Finally, at the end of the file, add this:
@xset s off
@xset -dpms
@xset s noblank
@chromium-browser —kiosk —incognito http://link-to-your-dashboard.com
Again, press Ctrl + O, Enter and Ctrl + X, Enter. Now reboot your Pi, by typing:
sudo reboot
Once your Pi boots, it should boot into the GUI, start the Chromium-browser and navigate to your dashboard.
Finishing off
Whether you choose to show your KPIs using Klipfolio, GeckoBoard or another service, I have now given you the tools to actually show the dashboards. The great thing about both the AirTame and the Raspberry Pi is, that you do not need to have an expensive computer sitting around, consuming a lot of power, to show your KPIs. I hope that I have also given you some thought on how and what to pick and show on your dashboard.
If you have any questions about the tools, the setup or anything else, feel free to add a comment and I’ll be happy to help out.
